What's new from Grafana Labs
Grafana Labs products, projects, and features can go through multiple release stages before becoming generally available. These stages in the release life cycle can present varying degrees of stability and support. For more information, refer to release life cycle for Grafana Labs.


Loading...
No results found. Please adjust your filters or search criteria.
There was an error with your request.
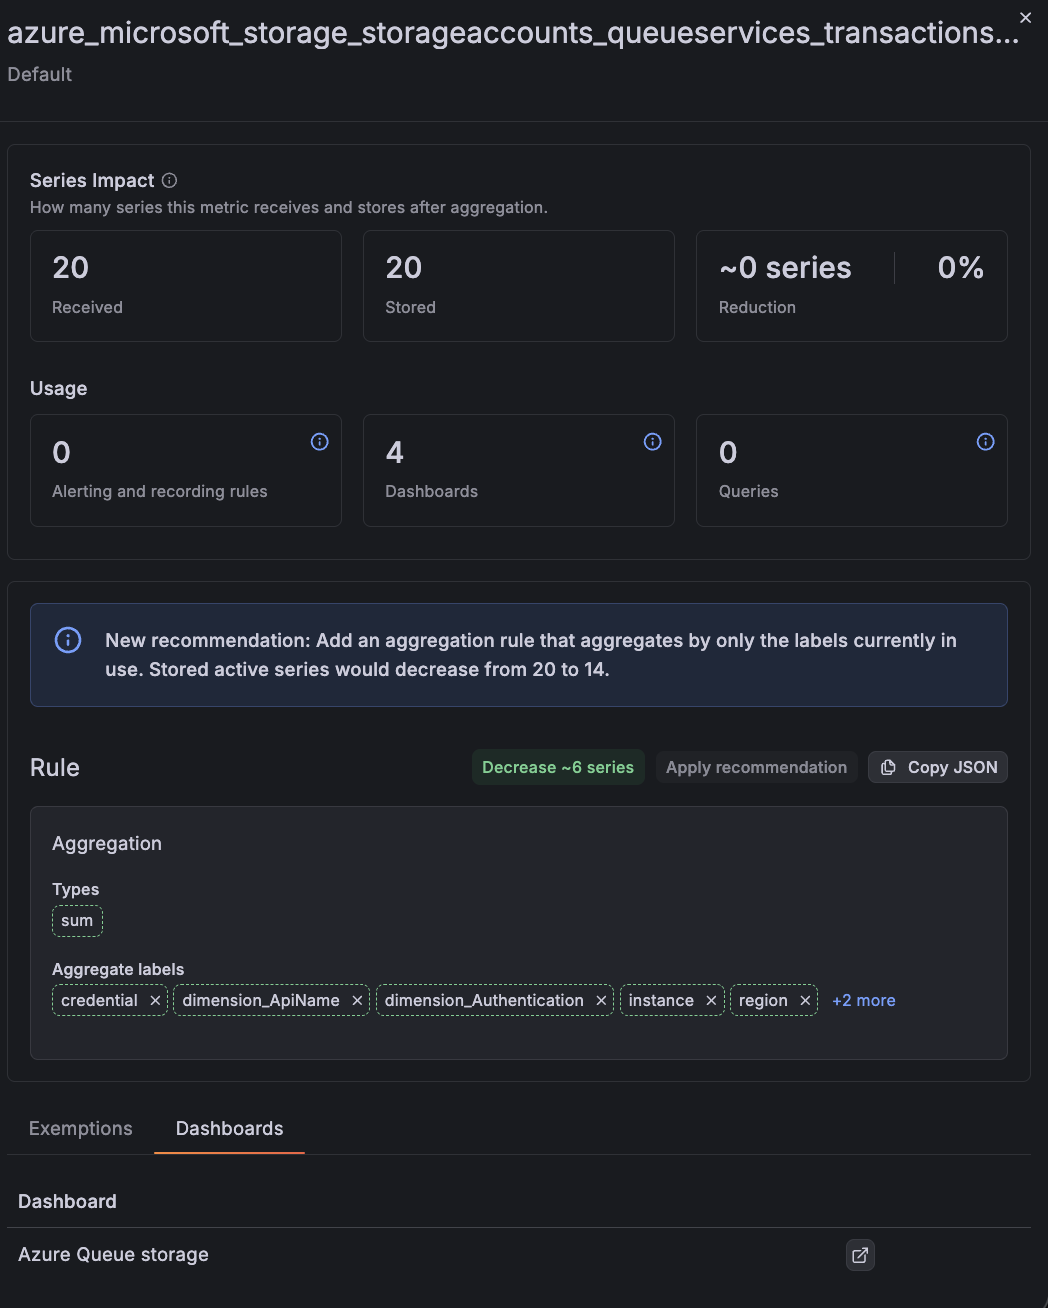
Get started optimizing your Cloud Metrics quickly and more easily.!
The Adaptive Metrics UI has been revamped to improve readability and instill confidence in our optimization recommendations. Here are a few of the highlights:
When an error appears in your app, you want to know which code change caused it — without digging through git log. Suspect Commits in Frontend Observability now pins the exact commit your app was built from at the top of the candidate list on the error summary page, so you can go straight from a stack trace to the change that introduced it.
After you’ve enabled the Kubernetes manifests feature, the k8s-manifest-tail component collects changes to resources on your Cluster. With this, you can these techniques to relate deployment changes to behavior you observe in Kubernetes Monitoring.
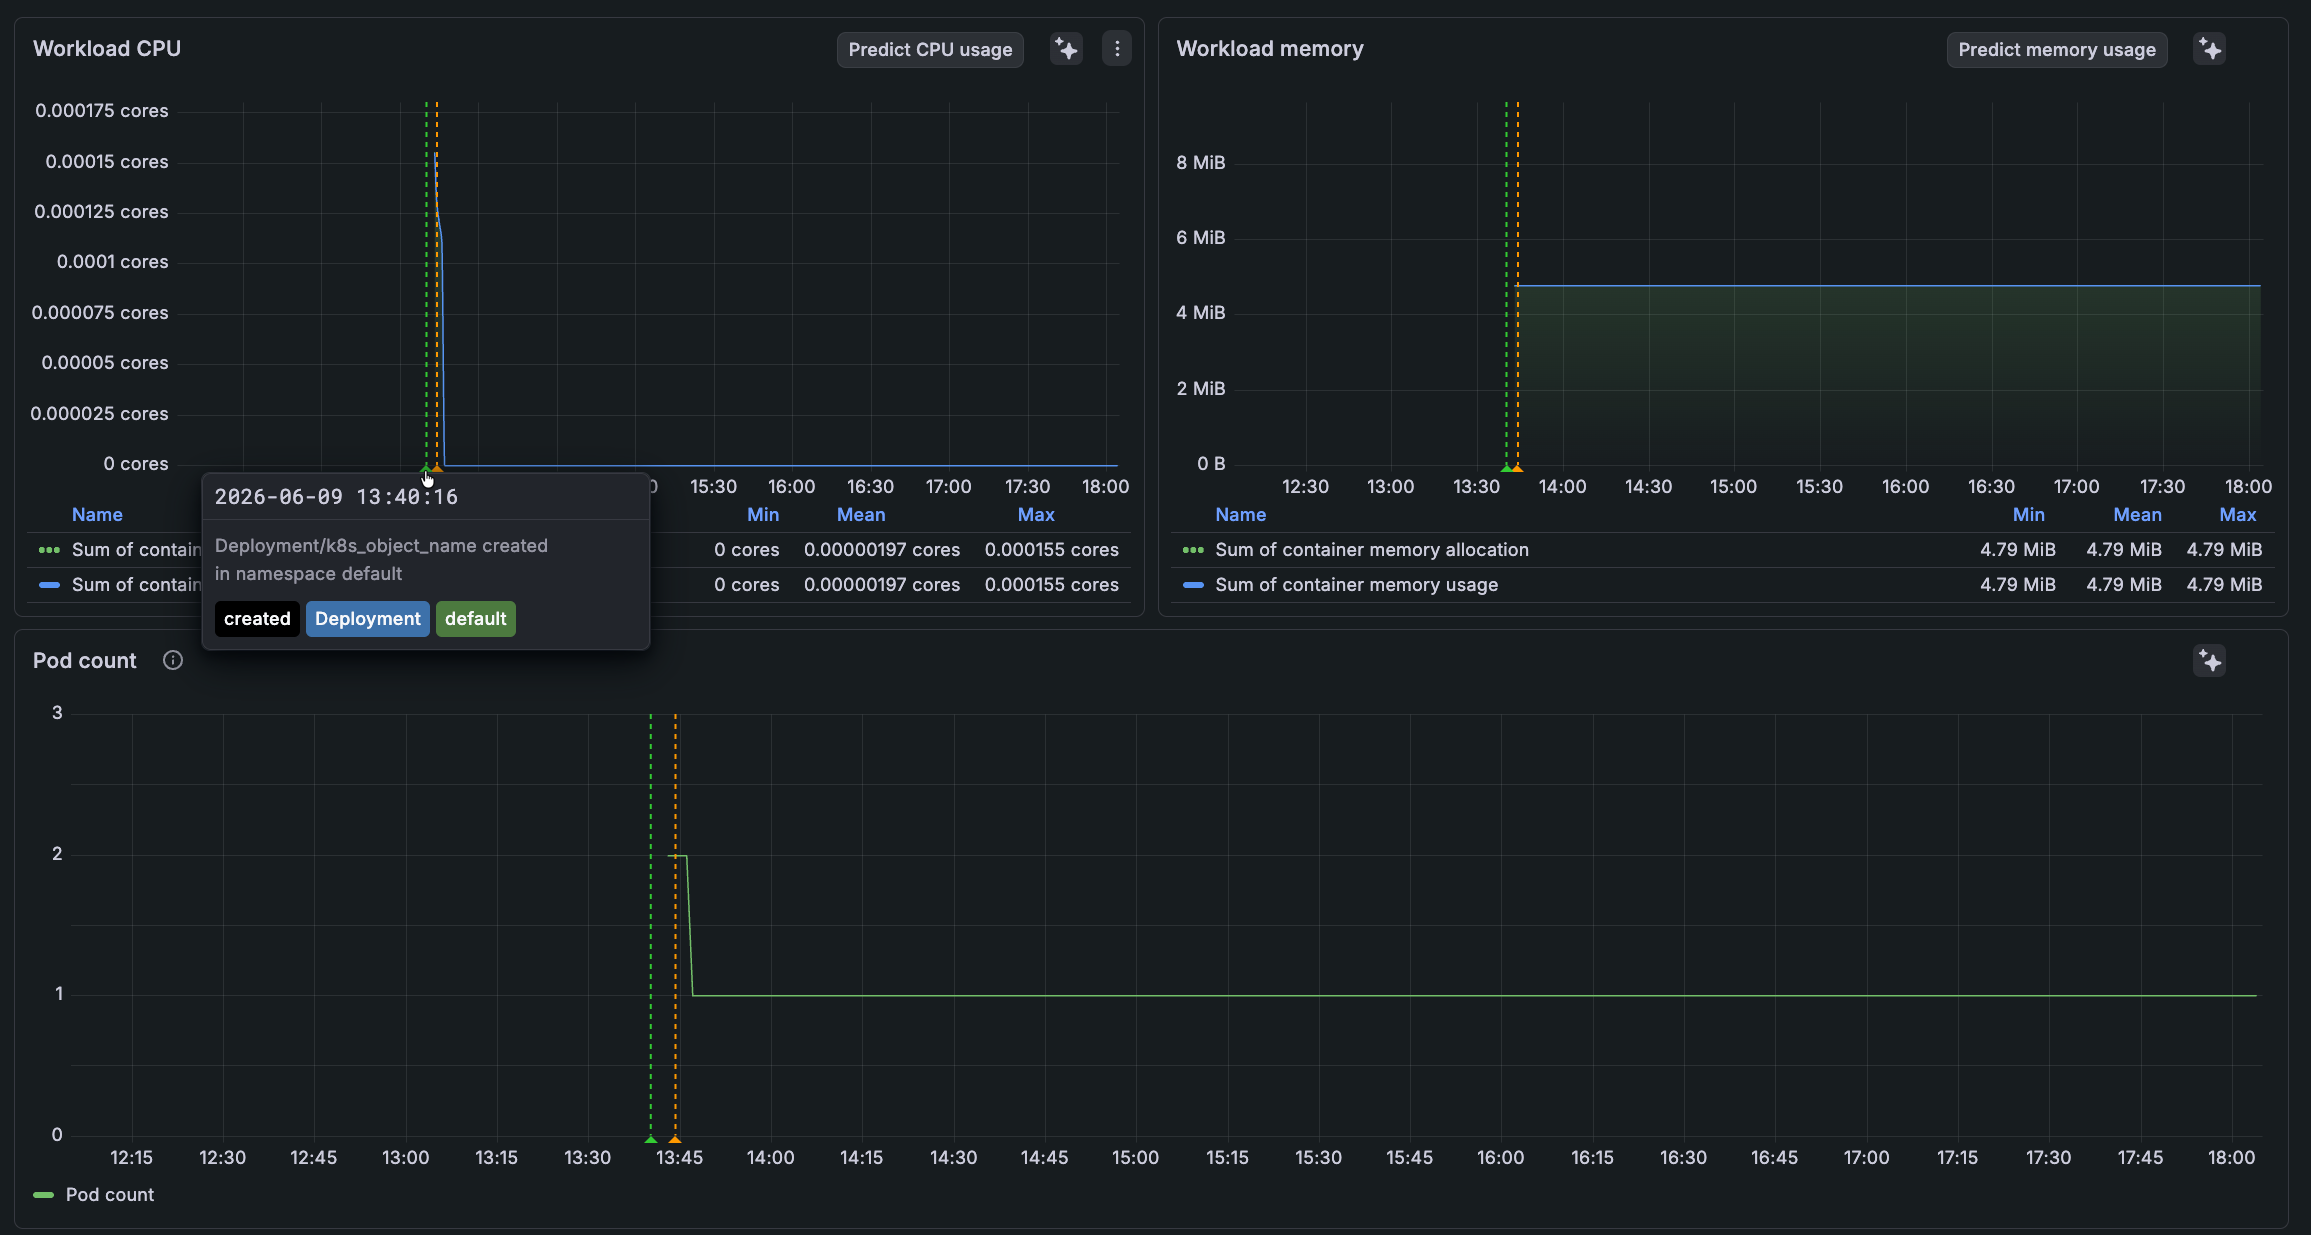
The Kubernetes Monitoring app runs health checks and notifies you on any detail page’s overview tab. This check surfaces problems in plain language before you even go looking.

Grafana Fleet Management recently made it easier to build Alloy configuration pipelines with the component editor. Now we’re introducing an additional tool to help you understand and manage your pipelines.
Grafana Cloud Synthetic Monitoring now gives you control over which k6 major version runs your scripted and browser checks. With k6 version channels, you can stay on a stable release while k6 continues to evolve, and move to a new major version on your own terms.
Introducing multi-factor authentication (MFA) for Grafana Cloud accounts.
You can add an extra layer of security to your Grafana Cloud accounts by enabling MFA on the new MFA page under User Settings. You can configure MFA with any standard TOTP authenticator app, including Google Authenticator, 1Password, Authy, and similar apps, by scanning a QR code during setup.
You can now monitor Amazon Aurora clusters directly in the AWS RDS preconfigured dashboard in Cloud Provider Observability. The new Aurora tab gives you a cluster-level view of capacity, storage, and performance so you can spot scaling issues and database bottlenecks without piecing together metrics from individual instances.
Grafana Assistant now supports eight new data sources
Grafana Assistant can now query Snowflake, MongoDB, Oracle, Elasticsearch, Dynatrace, Honeycomb, Zabbix, and Jira directly.
This means you can ask a single question and get answers that draw from across your observability stack, your databases, and your project tracking tools, without switching between systems. An investigation that starts with an alert can pull in error rates from Dynatrace, query performance from Oracle, and recent deployments from Jira, all in one conversation.
Private Data Source Connect (PDC) adds support for three new data sources: MQTT, GitHub, and IBM Db2.
PDC creates a private, encrypted tunnel between your Grafana Cloud stack and data sources running inside private networks, VPCs, or on-premises environments. No public endpoint required.
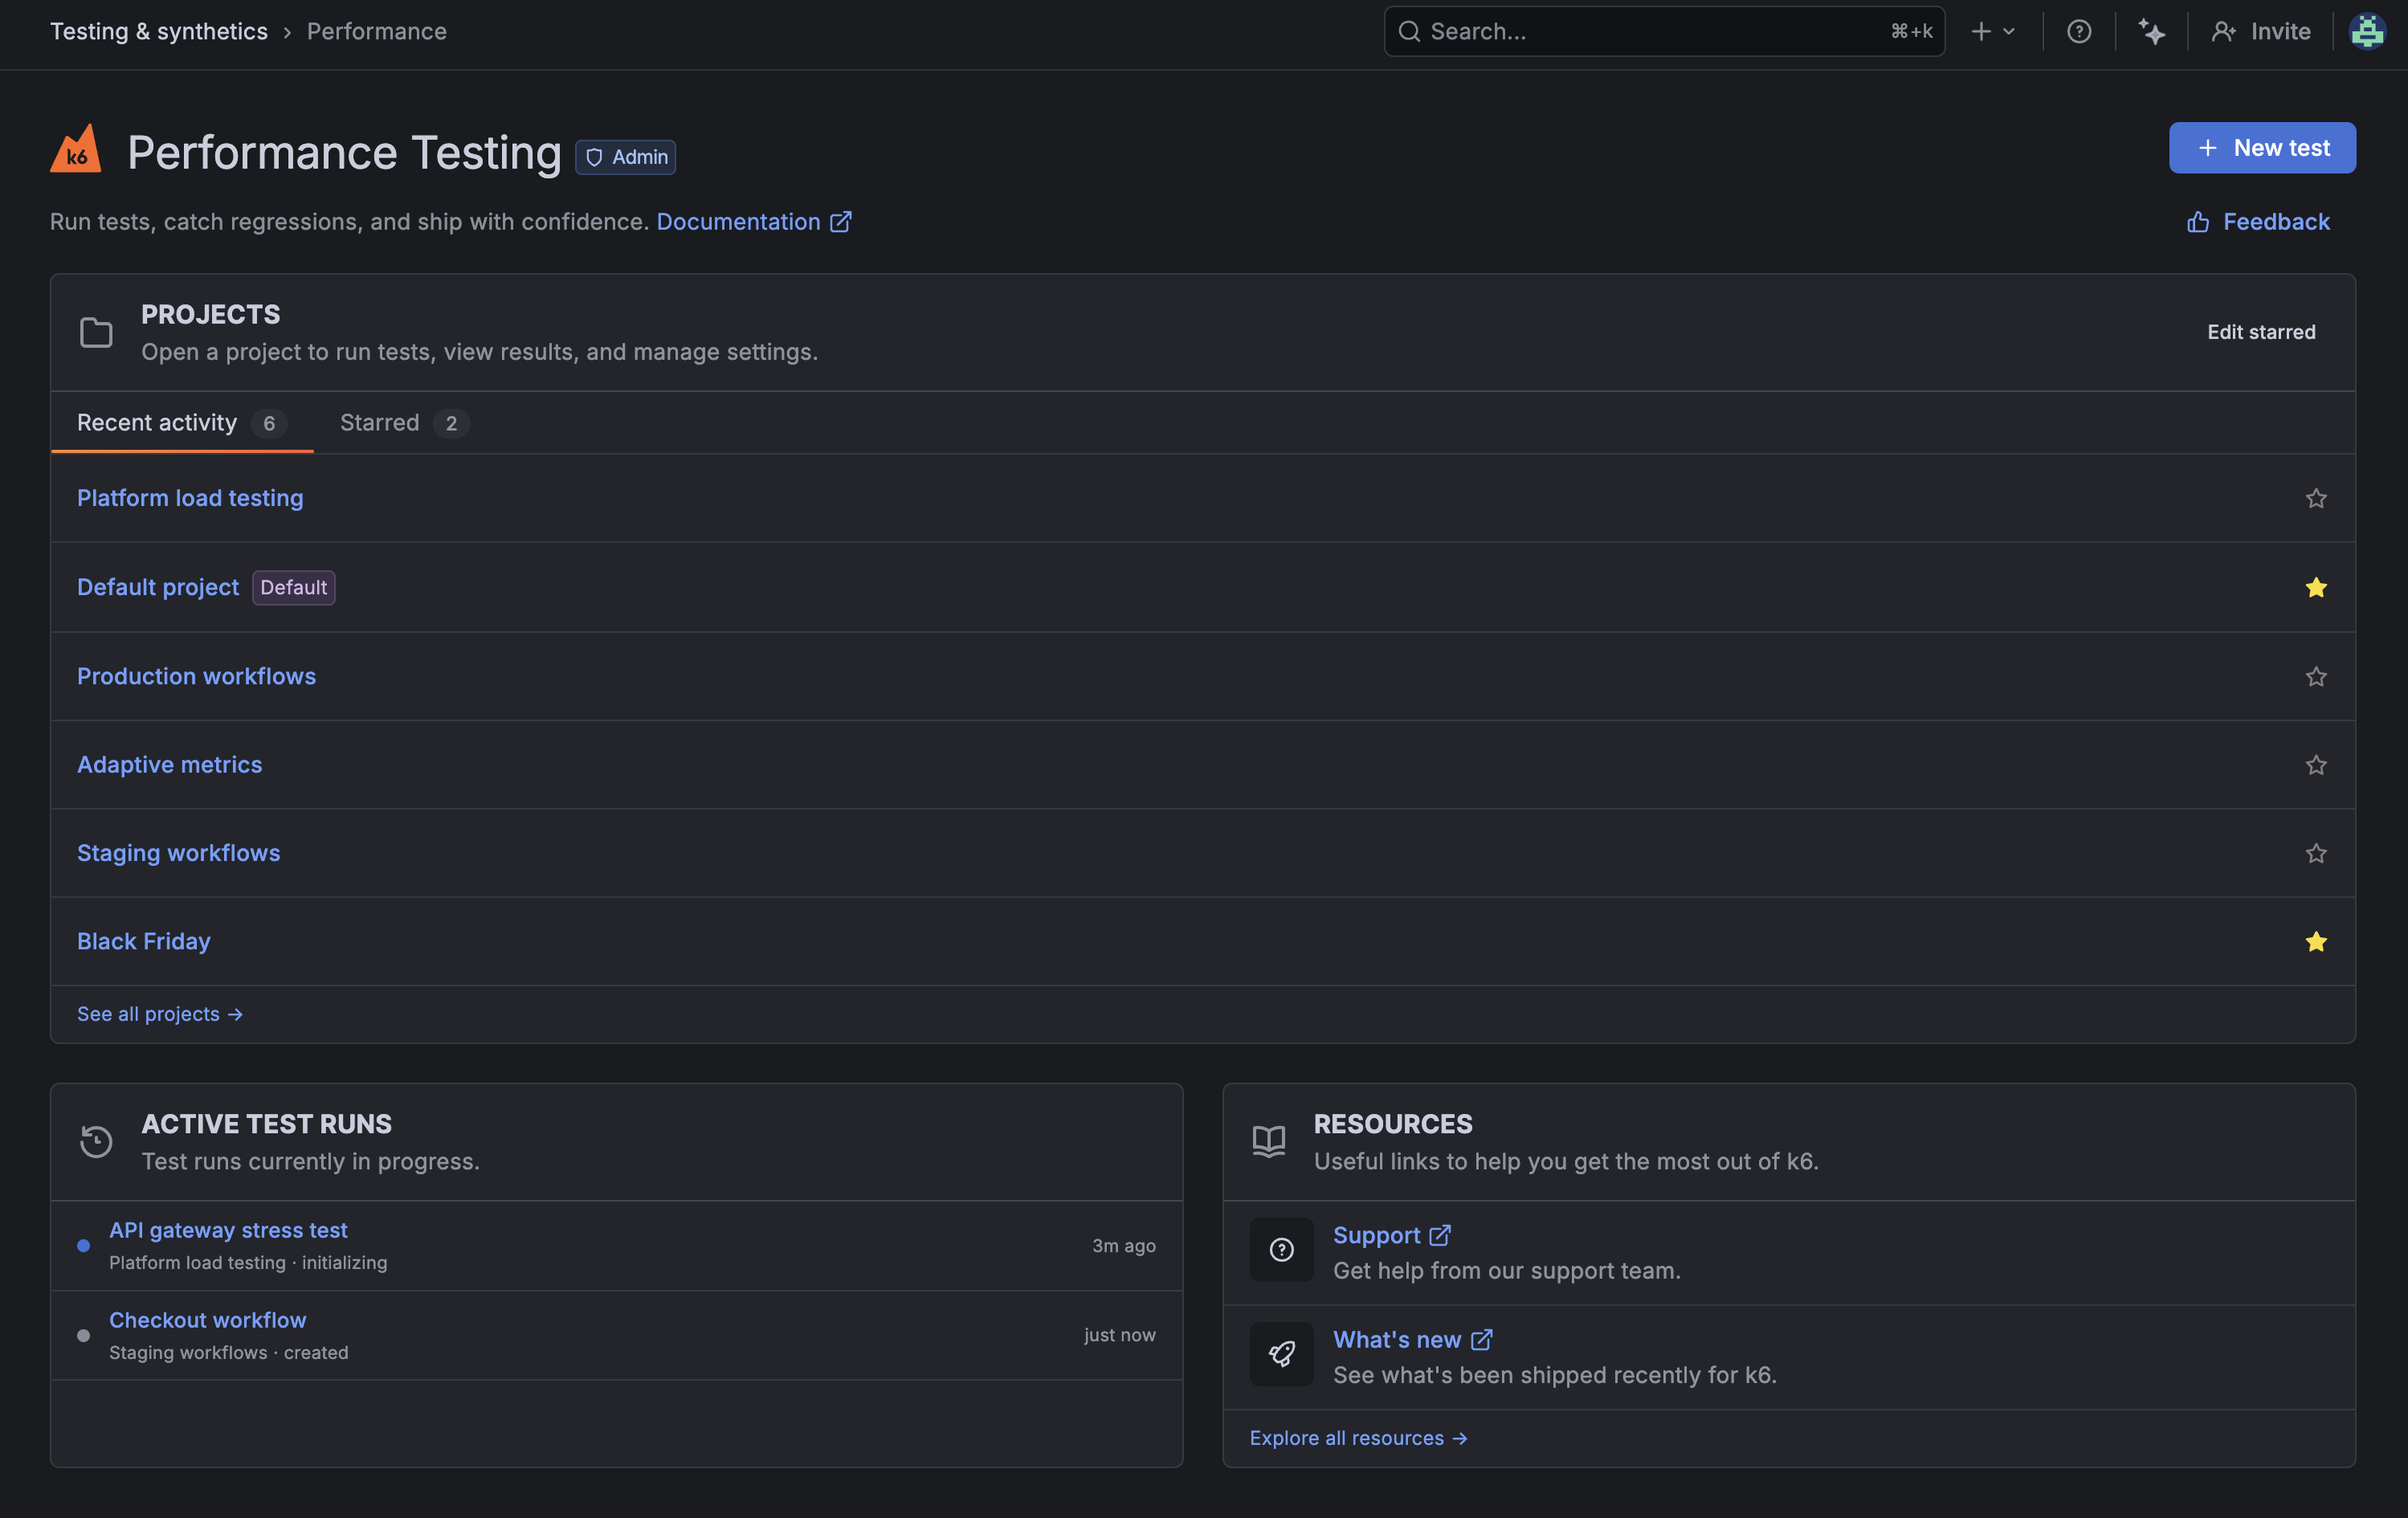
When you open Testing & synthetics > Performance, it can be hard to know where to start: which project to use, what tests are running now, and what you are allowed to do in your role.
We’ve updated the Grafana Cloud status page to improve clarity and better align component names with our current Grafana Cloud product naming. These changes make it easier to identify affected products and services during incident updates and status communications.
The copy and paste panel styles feature we announced in April 2026 is now generally available in all editions of Grafana. Copy display options and field styling from one panel and paste them onto another panel of the same type—without duplicating panels or reconfiguring options manually.
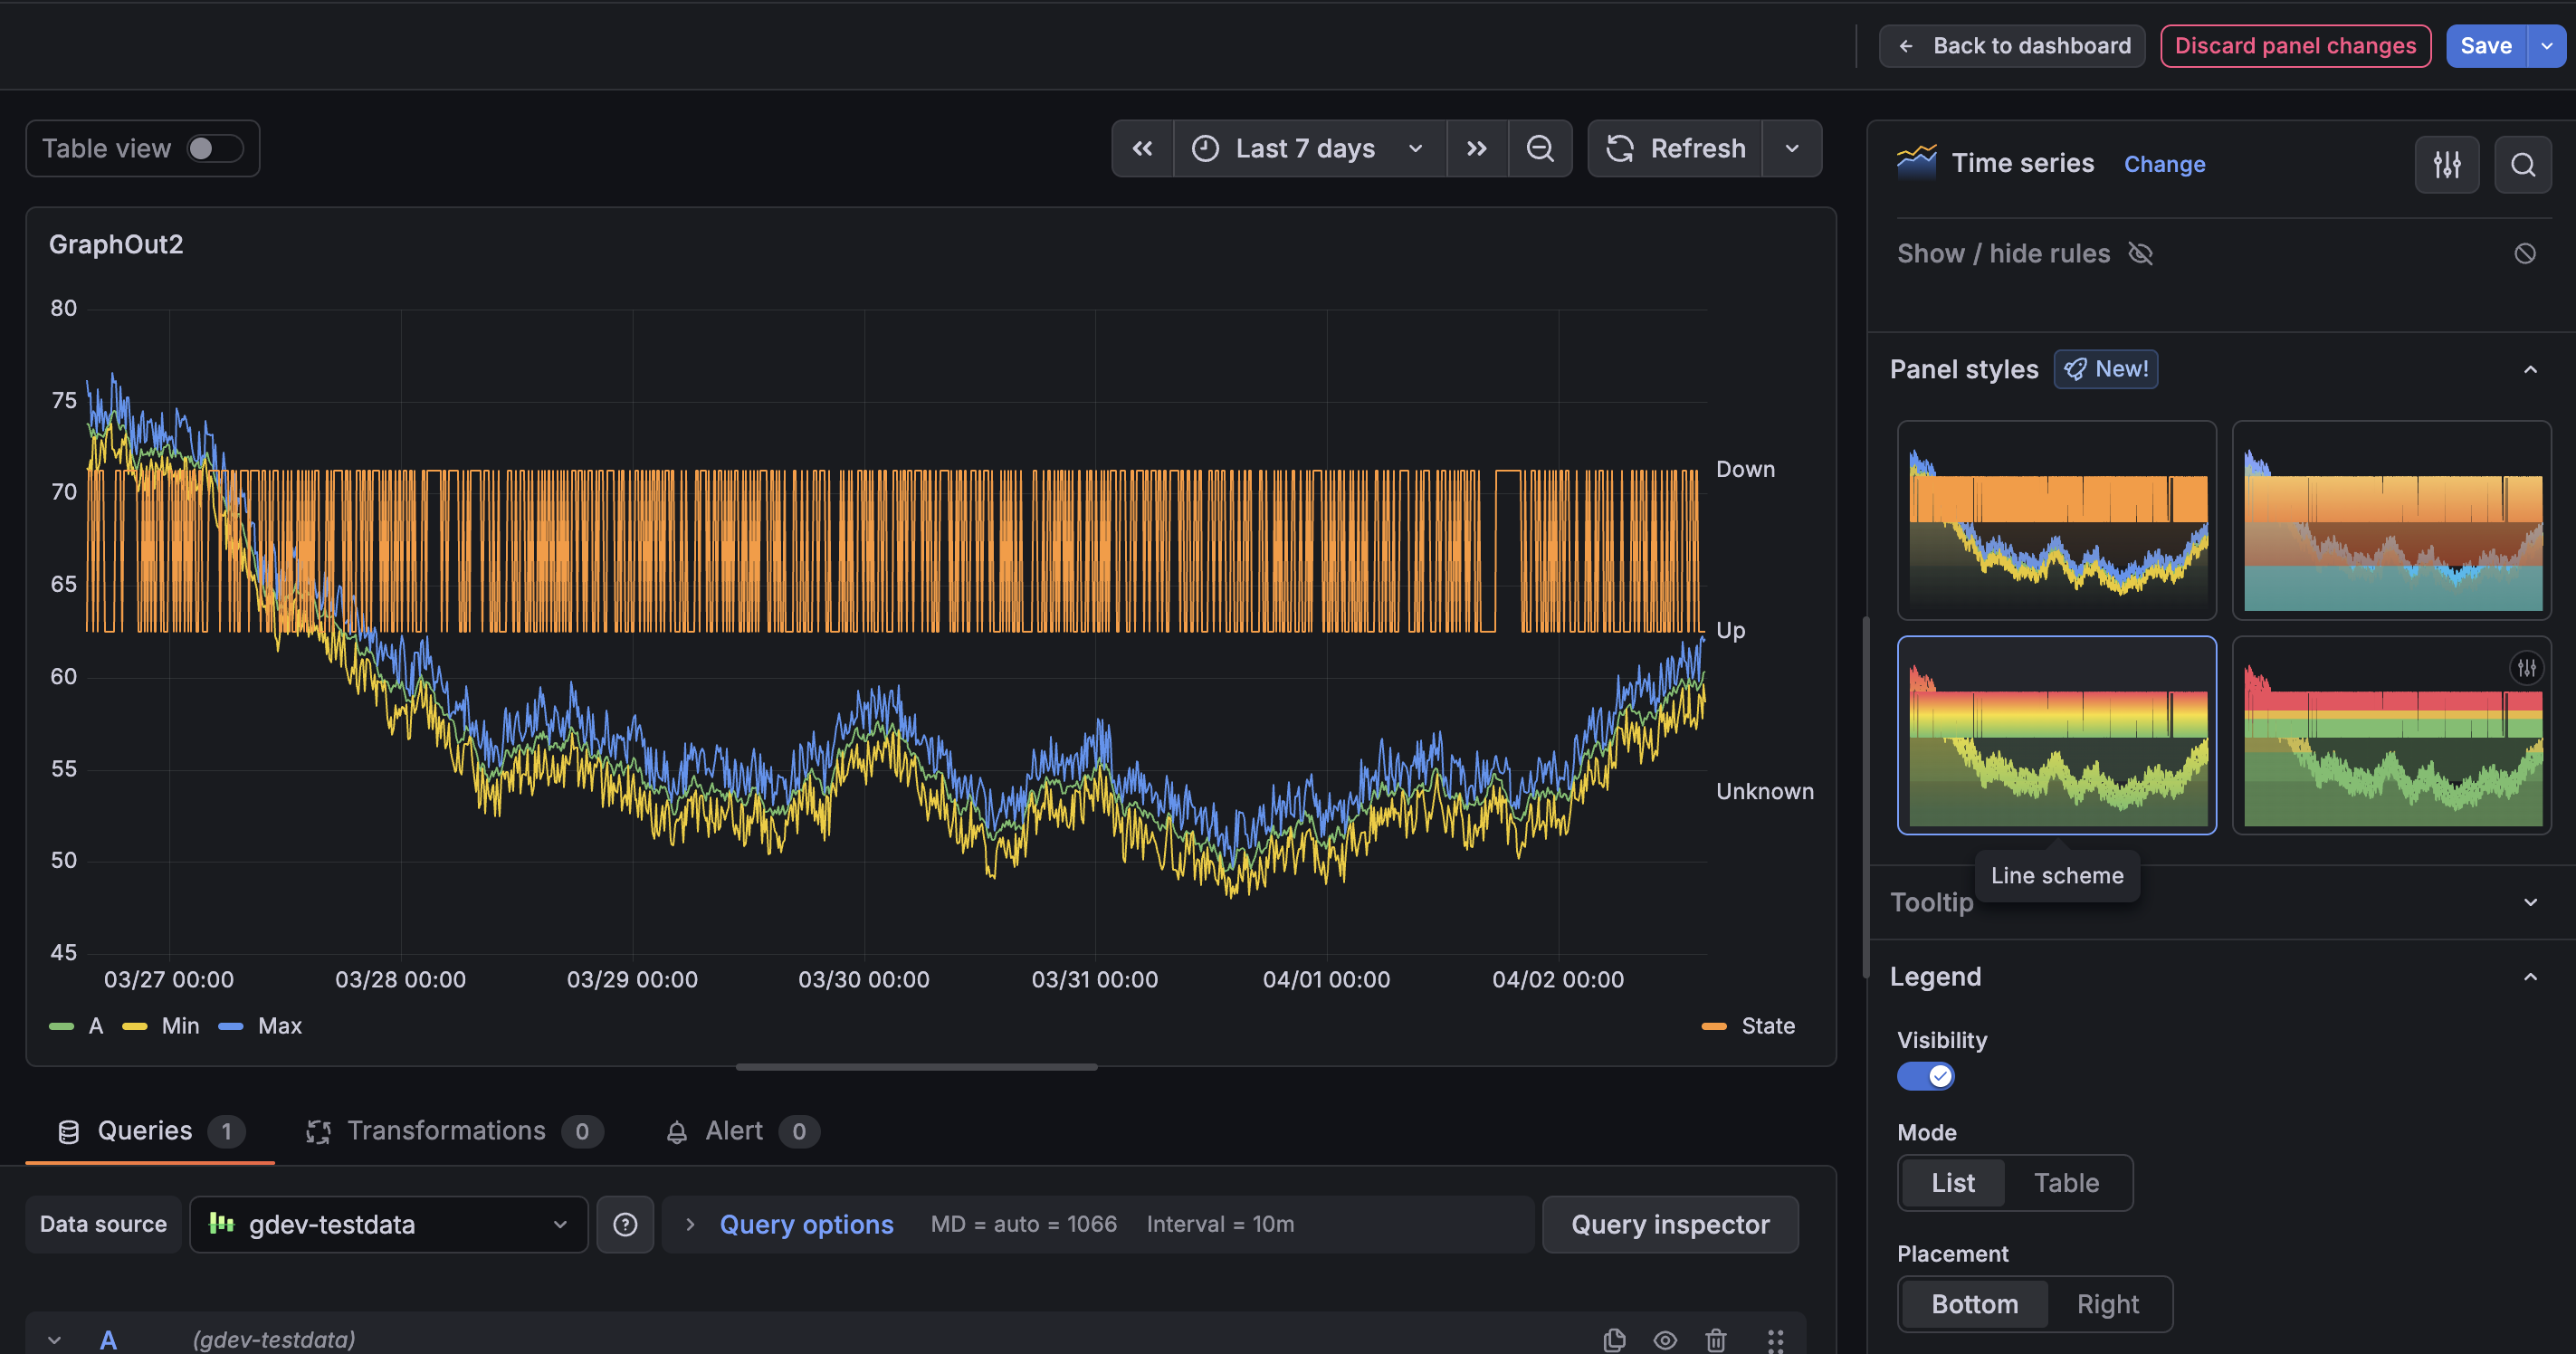
The panel styles we introduced earlier this year are now generally available in all editions of Grafana. Apply curated colors, thresholds, and display options to time series, stat, gauge, bar gauge, and bar chart panels with a single click in the panel editor.
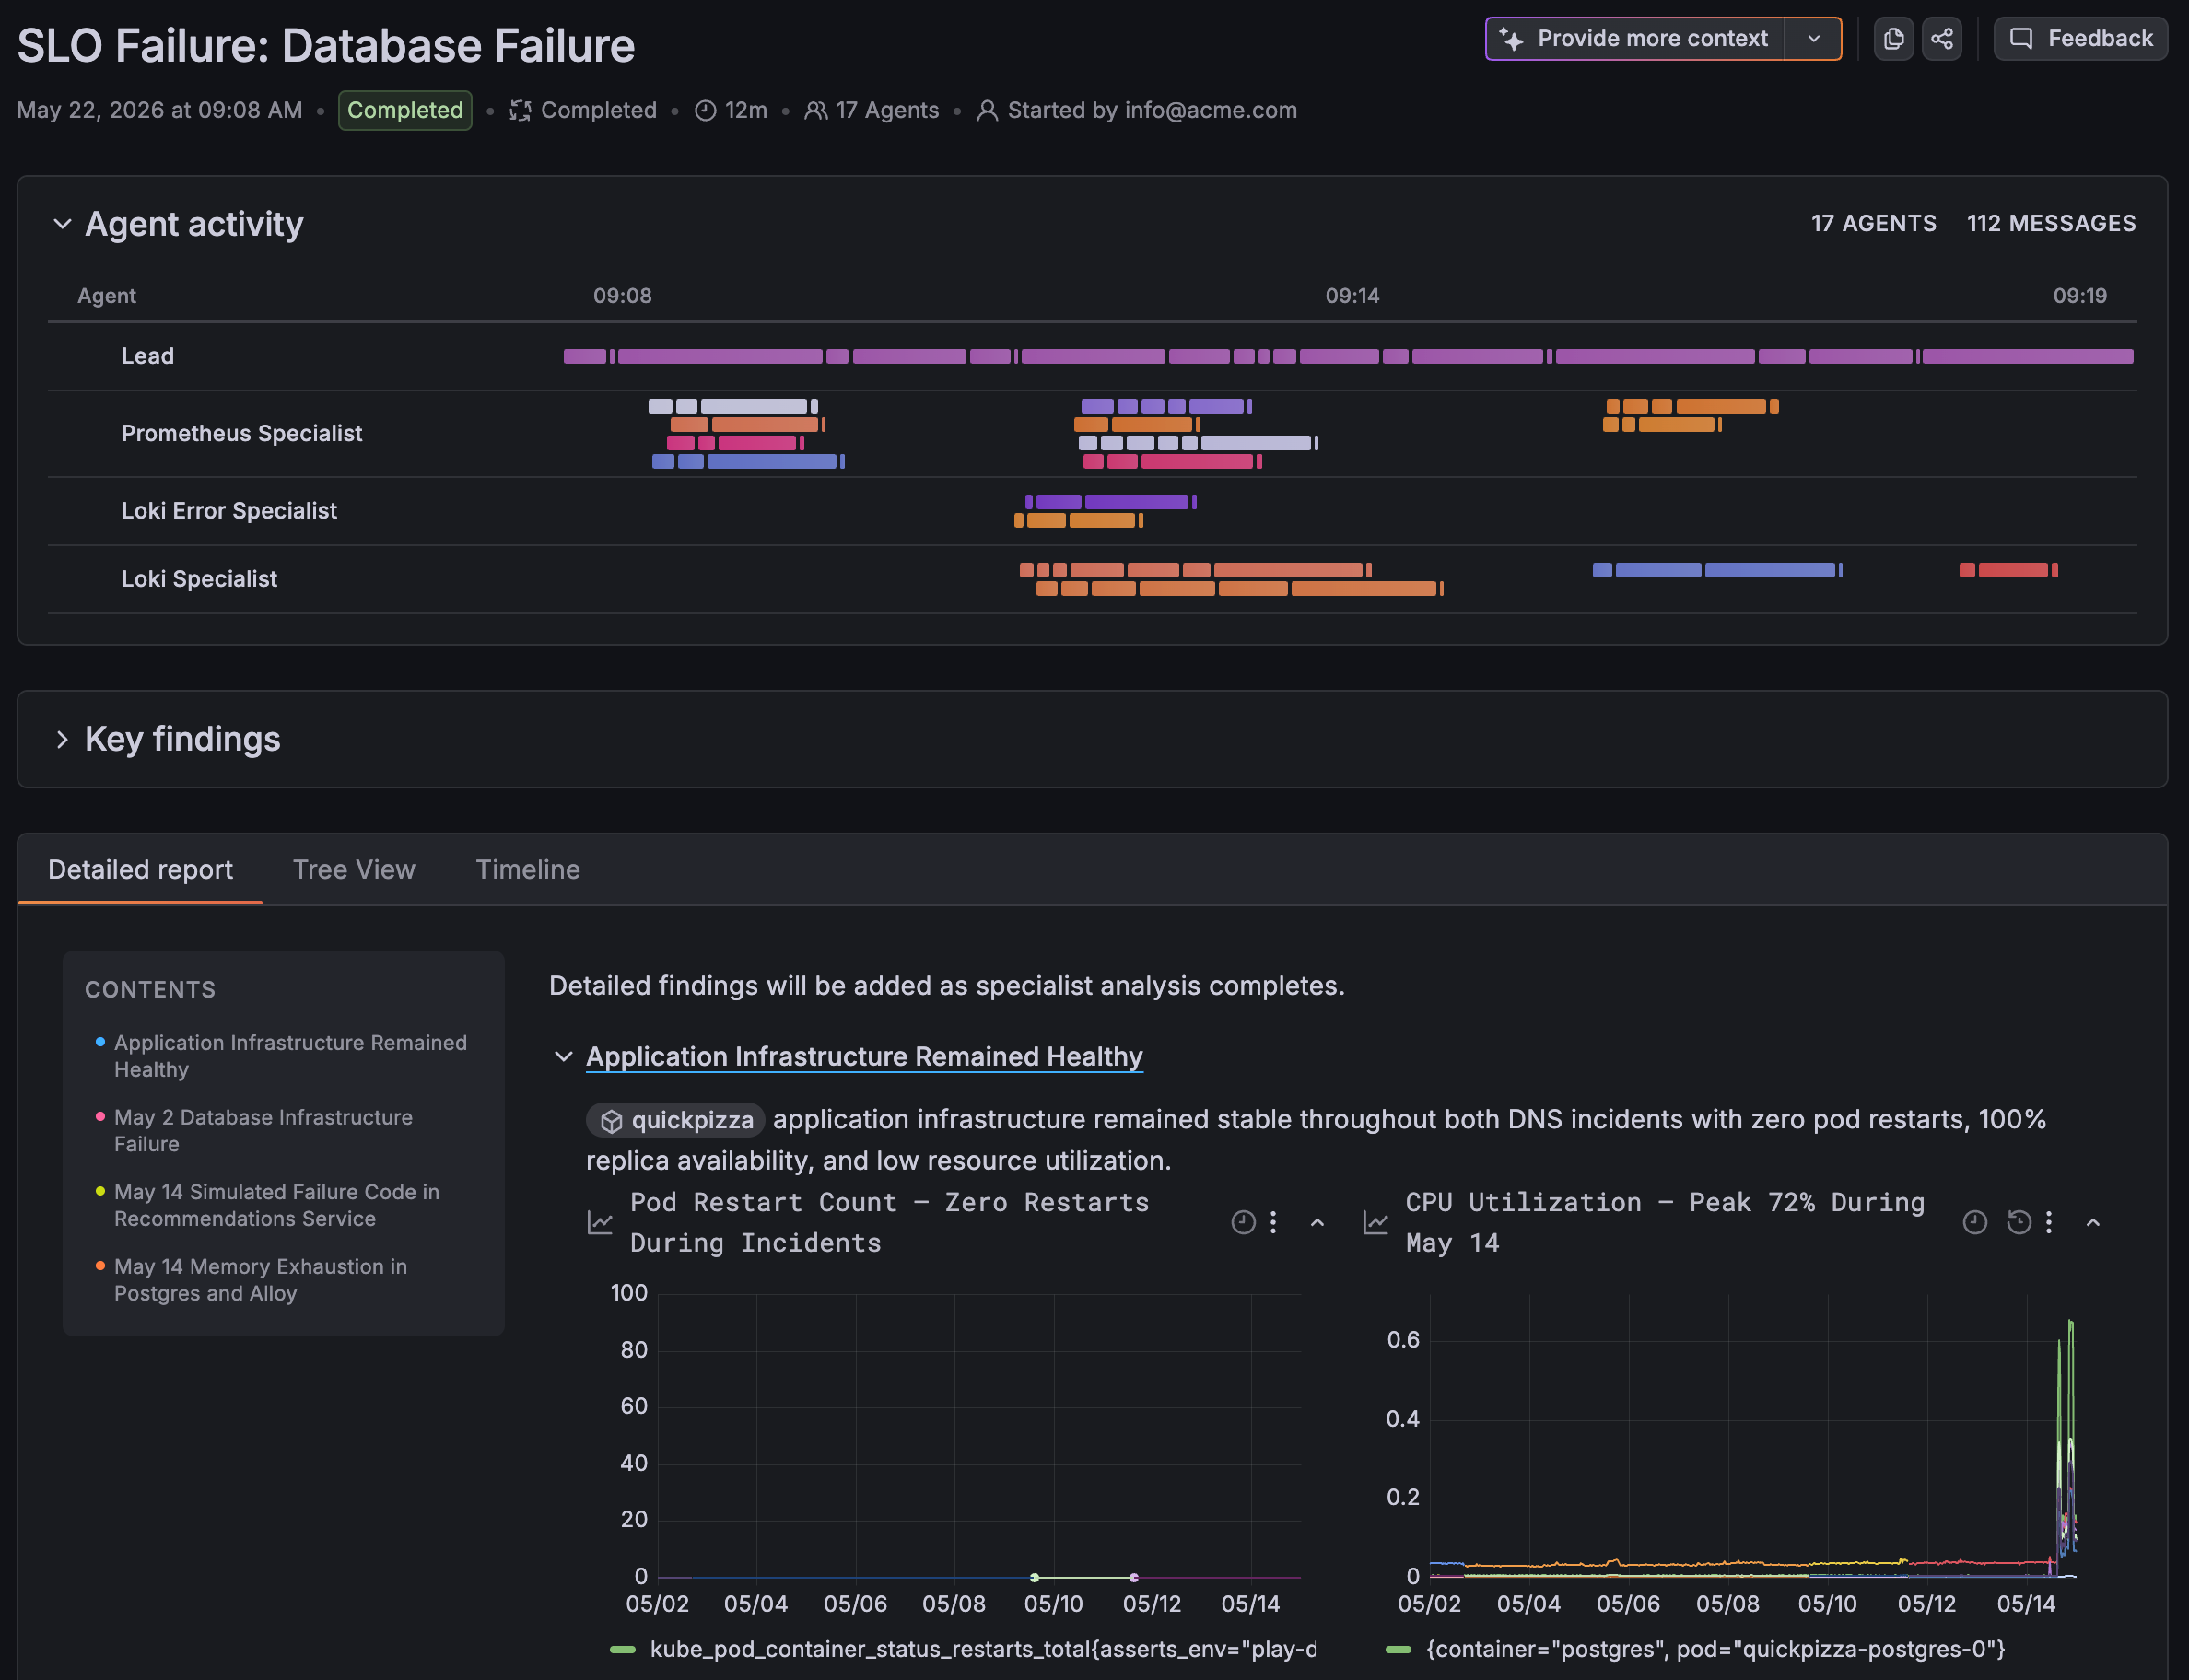
Grafana SLO now integrates with Assistant Investigations, helping teams move faster from SLO alerts to root cause investigation.
Assistant Investigations coordinate multiple agents to explore your observability stack and the data tied to your SLO, building a complete investigation report.