What's new from Grafana Labs
Grafana Labs products, projects, and features can go through multiple release stages before becoming generally available. These stages in the release life cycle can present varying degrees of stability and support. For more information, refer to release life cycle for Grafana Labs.


Loading...
No results found. Please adjust your filters or search criteria.
There was an error with your request.
On March 10, 2025, we started rolling out a default list of resource attributes as labels on Grafana Cloud Metrics. The goal is to simplify data exploration and correlation for customers sending OpenTelemetry metrics. We expect the total rollout time to be a few weeks.
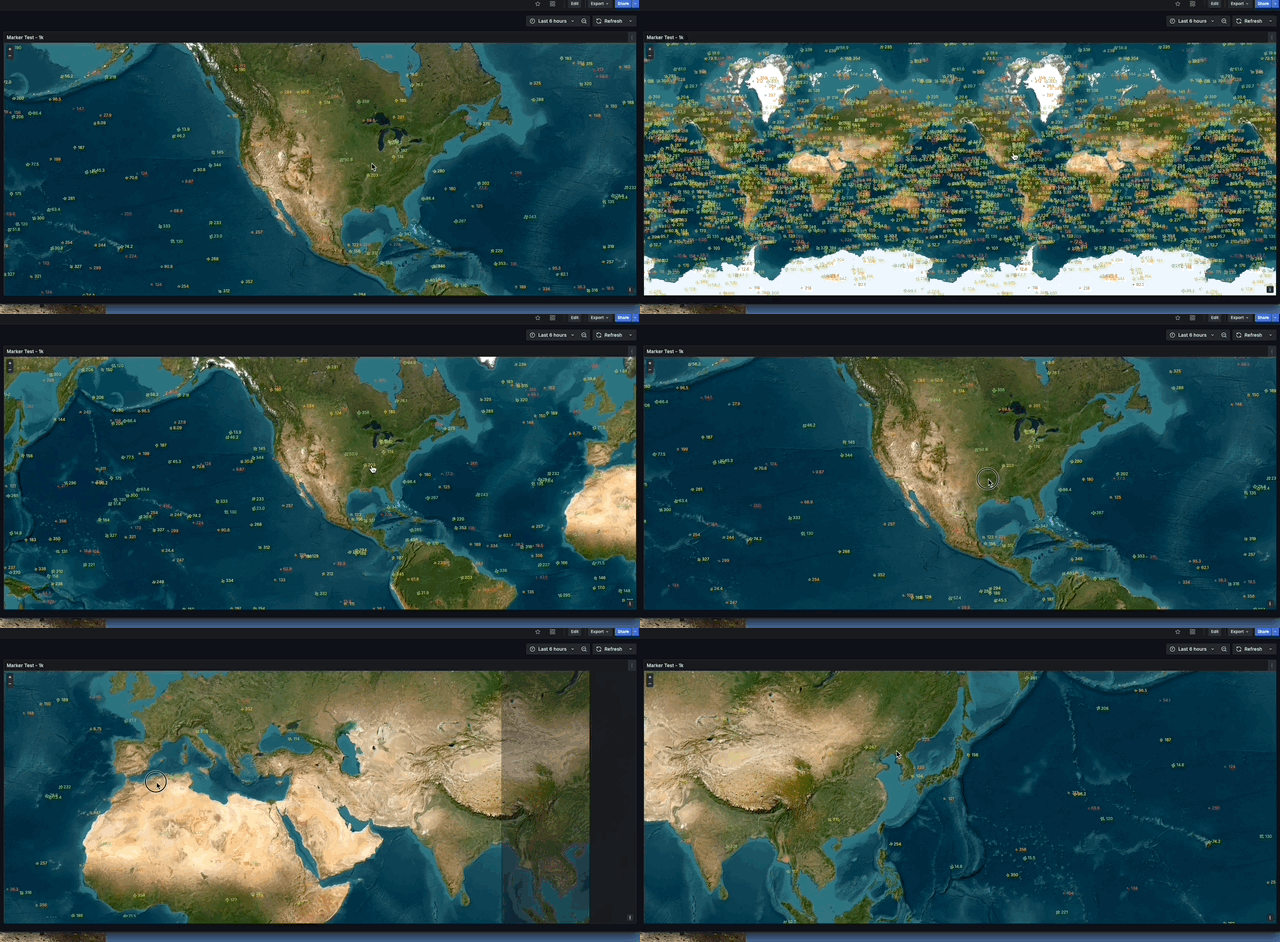
We’ve moved over to WebGL for geomap marker layers. You can expect a significant increase in performance and stability, which is especially noticeable for larger datasets.
The alert rule history
Alerting has added a new feature that allows you to review, compare, and restore previous alert rules.
You now can restore old rule versions from the versions tab in the detail view.
Grafana Managed Alerts now supports version history. You can view, compare, and restore your alert’s historical versions by navigating to the alert details view of any Grafana Managed Alert rule and clicking the Version tab.
It can be hard for teams to collaborate on dashboards when they have to use different data sources. Grafana instances can become cluttered and confusing with hundreds of data sources.
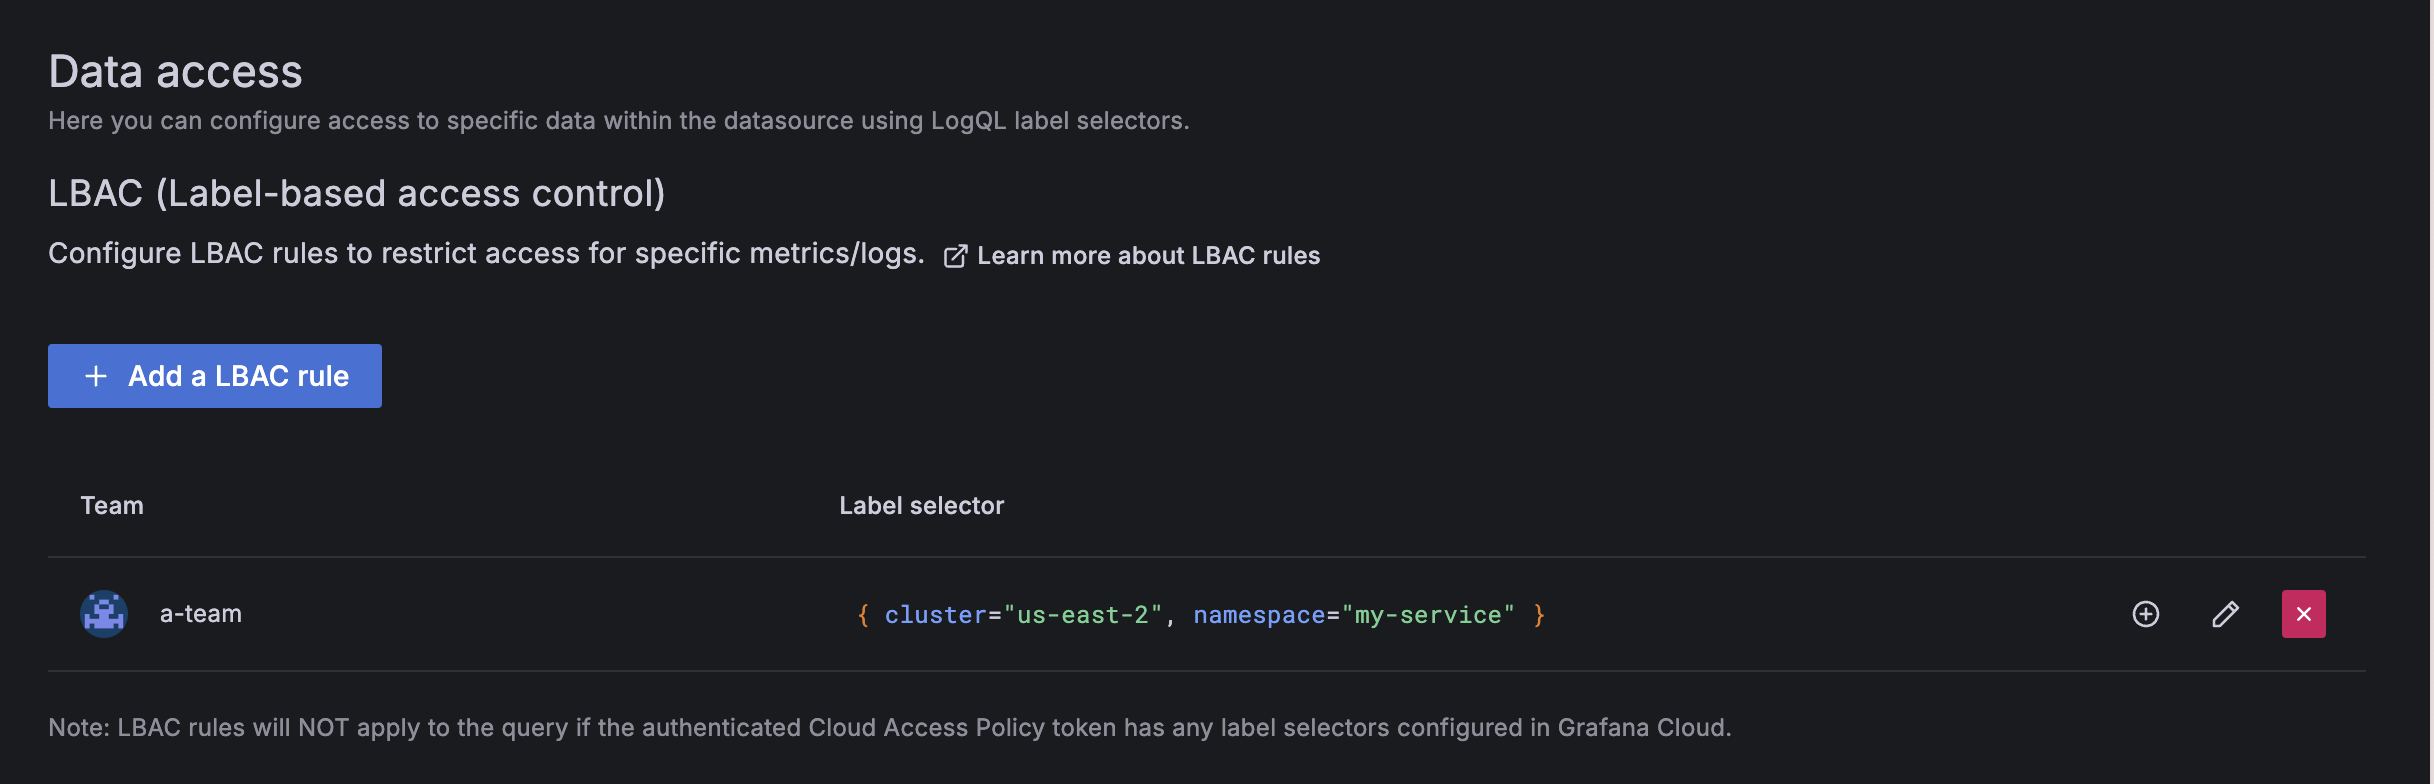
It can be hard for teams to collaborate on dashboards when they have to use different data sources. Grafana instances can become cluttered and confusing with hundreds of data sources.
The table visualization now includes a new Actions cell type, which lets you trigger actions directly from table cells. This enhancement allows you to define custom actions, such as triggering external workflows, from within a table column:
Actions for visualizations are now generally available. With actions, you can trigger basic, unauthenticated API calls from a dashboard panel. Previously experimental, actions are now generally available for the following visualizations:
Grafana SLO now supports Graphite, Splunk, and AppDynamics data sources, enabling teams to monitor and improve the reliability of even more of their services. You can now track SLOs across a broader range of observability data, ensuring more comprehensive service health insights and reducing alert fatigue.
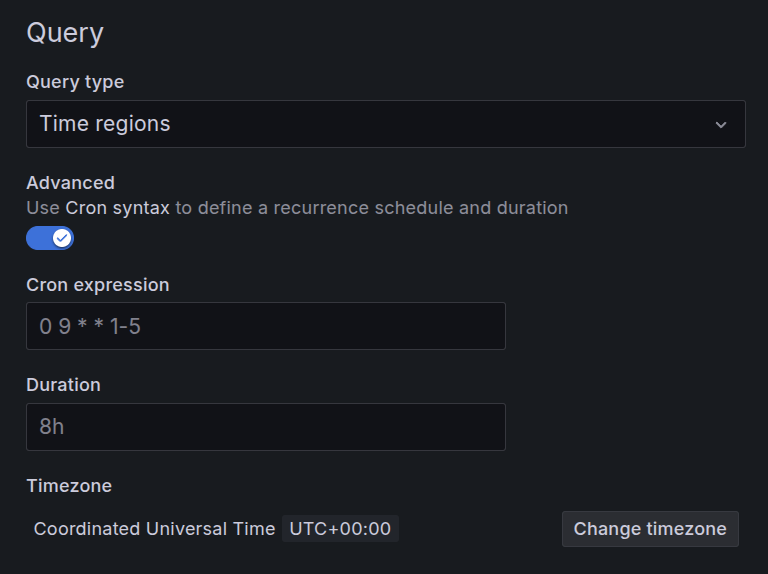
Using Cron syntax, you can define more granular schedules than previously possible with just weekday and time selections. For example, it is now possible to create a single time region query that marks periods like “At 21:00 on the second Tuesday of every other month” or “Weekdays 9-5.” To try it out create an Annotation, toggle the Advanced switch and use Cron syntax to set more granular time region controls.
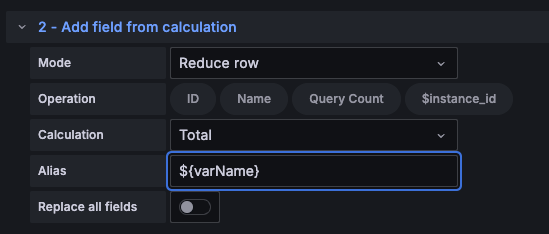
In previous releases, we added support for dashboard variables to a small number of transformations. Now this functionality has been added to all transformations, where applicable. All text input fields in transformations accept variable syntax:
You can now configure data links to be accessed with a single click. We’ve added the One click switch to data links for the following visualizations:
Grafana Fleet Management now includes the Grafana Cloud Integrations catalog, combining the preconfigured functionality of Integrations and the scalability of remote configuration.
Choose from a list of platform-specific integration templates to automatically build configuration pipelines in Fleet Management and then assign attributes to match those pipelines to specific collectors.
You can now provision your Grafana Fleet Management collectors and configuration pipelines using the Grafana Terraform provider (v3.19.0 or later).
Use Terraform to preregister new collectors for the Fleet Management service, add remote attributes to collectors that are already registered, and build configuration pipelines to remotely configure your fleet. With Terraform and Fleet Management, you can create a stable, consistent, scalable observability setup.
Last year we introduced one-click data links and actions for canvas visualizations in public preview and experimentally respectively. With the One click switch toggled on, it takes just a single click to open a data link or trigger an action. Now, both of these features are generally available for the canvas visualization.